Capital Asset Pricing Model:- Before going into detail of the capital asset pricing model (CAPM), let’s discuss some of the basic concepts of Risk and Return theory that is helpful in understanding CAPM.

- Risk
Risk is the combination of dangers and opportunities, or the volatility or spread, or uncertainty of the future outcomes over investment is called risk. Risk is measured in terms of standard deviation. Risk of a project is composed of two types.
Diversifiable Risk
It is the Risk that can be reduced through diversification in investments in uncorrelated projects. The unfavorable random events of one project are equalized through the favorable events of other projects.
Market Risk:
It is that part of total risk that cannot be reduced through diversification. It is related to the unfavorable socio-political and economic events that are taking place globally and that affects almost all the companies of the industry in a country like inflation, market interest rates, war, etc.
- Return:
If there is a risk than definitely there must be some return against that risk, which is a logical thing to understand. An investor only takes an additional risk, if the certain additional return is offered against that risk.
- Beta:
Beta is the building block of CAPM theory. In the case of a stock market, the inclination of stock to accelerate with the market is called beta.
Capital Asset Pricing Model
Sharpe and Markowitz are professors who had to develop of capital asset pricing model, which is considered to an important theory in the risk & return portion. Every rational investor wants to maximize the return on his investment at the lowest possible risk.
The investor diversifies his investments over a number of uncorrelated projects in order to eliminate his company-specific (diversifiable) risk. So, the remaining portion of the risk in the portfolio of the investor is the only market risk that cannot be reduced by diversification.
In the case of a portfolio of stocks, there is an index that reflects the Weighted Average of all the transactions on that stock market. The index is a measure of the relative strength of the stock exchange. In reality, there is no stock exchange that is fully diversified.
In CAPM Model, it is assumed that the beta of the market is equal to +1. There are betas of different stocks of a company that are published by rating agencies and stock brokerages. These individual stock betas are compared with the market beta of the stock exchange.
Example:
Suppose in the New York stock exchange there is a trading of stocks of different companies. If the beta of a share A is equal to +1.0, then this means that the share is exactly as risky as the market is. In other words, if the market index, that is 100, goes up to 5% after one year, then the stock A’s beta also goes up to 5% based on the historical data.
If beta of a stock B is +2, then the stock B is double risky as the beta of the New York stock exchange.
If a stock has a beta of -1, then this stock is as much risk as to the market of the stock exchange, But in the opposite direction. In other words, if the stock exchange goes up by 5% in a year then the stock goes down by 5%.
If a stock of beta E is +0.5, then this stock is half as risky as the market of the stock exchange.
The formula of the Beta of a Stock:
In a stock exchange, there is some risk of the market that is indicated through the movements in the index of the stock exchange. There is also a stock X whose price also changes from one year to another. The movement in the value of a stock relative to the market index is ascertained from one year to another.
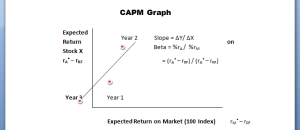
Capital Asset Pricing Model Graph
The above graph shows the beta of the stock X in a stock exchange of index 100. The value of the stock X is shown as expected return (rA) on the y-axis whereas the market price is also represented as expected return (rM), but on the x-axis.
The risk-free rate of return is treated as the starting point to measure the movement in the value of both the individual stock X and the market price of the stock exchange (Index). There are points on the graph that shows the relative movement of stock X each year.
The best line of linear regression is made to fit in the graph in order to that passes through these points. If a slope is drawn on the two points of the regression line, then this slope gives the relative risk of the stock X to the overall stock market which is called the beta coefficient.
The formula of the beta coefficient of stock X is given below.
Beta = Slope = ΔY/ ΔX
= %rA / %rM
= (rA* – rRF) / (rA* – rRF)
In the light of above formula, the coefficient beta is defined as the difference between the expected rate of return of Stock X and the risk-free rate of return whole divided by the difference of market rate of return and the risk-free rate of return.
Portfolio Beta of CAPM:
01- For the calculation of stock beta, there are two ways that are as follows.
The first method is similar to the above least square method of stock beta. On the basis of historical data, the movements in the portfolio returns and market returns are shown on the graph on the x-axis and y-axis respectively. After fitting a regression line through the points, the slope of the line gives the portfolio beta.
02- In the second method, the published stock betas of the individual stocks in a portfolio are averaged on the weighted average basis to give the portfolio beta of all the stocks. Numerically
β(P) = XA βA + XB βB + XC βC + … β
If you like my article, please comment below and share the link with others.

Hello everyone! This is Richard Daniels, a full-time passionate researcher & blogger. He holds a Ph.D. degree in Economics. He loves to write about economics, e-commerce, and business-related topics for students to assist them in their studies. That's the sole purpose of Business Study Notes.
Love my efforts? Don't forget to share this blog.


